Simulation of a Stochastic Model for the AKAP79 reaction network
simAKAP79stochastic.Rmd
require(SBtabVFGEN)
#> Loading required package: SBtabVFGEN
library(uqsa)
#>
#> Attaching package: 'uqsa'
#> The following object is masked from 'package:SBtabVFGEN':
#>
#>     unit.from.string
library(GillespieSSA2)
This article provides code to simulate the AKAP79 stochastic model (one time, no sampling). We are plotting the model with default parameters which are not expected to fit the data (this is the starting point).
The Stochastic Model
When the copy number of molecular species in a reaction network system (AKAP79 in our case) is low, we cannot model the amount of molecules deterministically (e.g., with an ODE model), because the stochasticity in the reactions that take place cannot be ignored. In particular, the time at which reactions take place is random, as well as the specific reactions that take place (i.e., what pair of molecules react). To model such system we can use the chemical master equation (CME): we model the (integer) number of each molecule species in the system (e.g., proteins) and how the number of each molecule type (randomly) evolves in time. The likelihood of this model is hard to compute; however, we can easily sample trajectories from this stochastic model using the Gillespie algorithm. Given the current amount of each molecular species in the system at a given time point, we can sample the time at which the next reaction takes place and we can sample the type of reaction (i.e., what pair of molecules react).
To obtain the stochastic model for the reaction network, we need to compute the reaction propensities. These can be related to the reaction rate coefficients, that are the parameters that we usually use in our models, and on which we perform uncertainty quantification. To derive the reaction propensities we referred to this article.
Load the Model
This model is included with the package. To load your own model, see the article “Build and simulate your own Model”.
m <- model_from_tsv(uqsa_example("AKAP79"))
cme <- as_cme(m)    # chemical master equation, stochastic model
c_path(cme) <- write_c_code(generate_code(cme))
so_path(cme) <- shlib(cme)
Load Experiments (data)
ex <- experiments(m)
print(ex)
#> number of simulation experiments: 25
#>                   EX11____0nM__TRUE___TRUE
#> ------------------------------------------
#>             measurements: 2 columns (data.frame)
#>                     data: 1, 125 (dim)
#>                    input: 1
#>              initialTime: -30
#>             initialState: 16 (length)
#>              outputTimes: 125 (length)
#>                   events: NULL (class), NULL (type)
#>
#>                   EX12____0nM__TRUE__FALSE
#> ------------------------------------------
#>             measurements: 2 columns (data.frame)
#>                     data: 1, 125 (dim)
#>                    input: 0
#>              initialTime: -30
#>             initialState: 16 (length)
#>              outputTimes: 125 (length)
#>                   events: NULL (class), NULL (type)
#>
#>                   EX13____0nM_FALSE__FALSE
#> ------------------------------------------
#>             measurements: 2 columns (data.frame)
#>                     data: 1, 125 (dim)
#>                    input: 0
#>              initialTime: -30
#>             initialState: 16 (length)
#>              outputTimes: 125 (length)
#>                   events: NULL (class), NULL (type)
#>
#>                   EX21__100nM__TRUE___TRUE
#> ------------------------------------------
#>             measurements: 2 columns (data.frame)
#>                     data: 1, 125 (dim)
#>                    input: 1
#>              initialTime: -30
#>             initialState: 16 (length)
#>              outputTimes: 125 (length)
#>                   events: NULL (class), NULL (type)
#>
#>                   EX22__100nM__TRUE__FALSE
#> ------------------------------------------
#>             measurements: 2 columns (data.frame)
#>                     data: 1, 125 (dim)
#>                    input: 0
#>              initialTime: -30
#>             initialState: 16 (length)
#>              outputTimes: 125 (length)
#>                   events: NULL (class), NULL (type)
#>
#>                   EX23__100nM_FALSE__FALSE
#> ------------------------------------------
#>             measurements: 2 columns (data.frame)
#>                     data: 1, 125 (dim)
#>                    input: 0
#>              initialTime: -30
#>             initialState: 16 (length)
#>              outputTimes: 125 (length)
#>                   events: NULL (class), NULL (type)
#>
#>                   EX31__200nM__TRUE___TRUE
#> ------------------------------------------
#>             measurements: 2 columns (data.frame)
#>                     data: 1, 125 (dim)
#>                    input: 1
#>              initialTime: -30
#>             initialState: 16 (length)
#>              outputTimes: 125 (length)
#>                   events: NULL (class), NULL (type)
#>
#>                   EX32__200nM__TRUE__FALSE
#> ------------------------------------------
#>             measurements: 2 columns (data.frame)
#>                     data: 1, 125 (dim)
#>                    input: 0
#>              initialTime: -30
#>             initialState: 16 (length)
#>              outputTimes: 125 (length)
#>                   events: NULL (class), NULL (type)
#>
#>                   EX33__200nM_FALSE__FALSE
#> ------------------------------------------
#>             measurements: 2 columns (data.frame)
#>                     data: 1, 125 (dim)
#>                    input: 0
#>              initialTime: -30
#>             initialState: 16 (length)
#>              outputTimes: 125 (length)
#>                   events: NULL (class), NULL (type)
#>
#>                   EX41__500nM__TRUE___TRUE
#> ------------------------------------------
#>             measurements: 2 columns (data.frame)
#>                     data: 1, 125 (dim)
#>                    input: 1
#>              initialTime: -30
#>             initialState: 16 (length)
#>              outputTimes: 125 (length)
#>                   events: NULL (class), NULL (type)
#>
#>                   EX42__500nM__TRUE__FALSE
#> ------------------------------------------
#>             measurements: 2 columns (data.frame)
#>                     data: 1, 125 (dim)
#>                    input: 0
#>              initialTime: -30
#>             initialState: 16 (length)
#>              outputTimes: 125 (length)
#>                   events: NULL (class), NULL (type)
#>
#>                   EX43__500nM_FALSE__FALSE
#> ------------------------------------------
#>             measurements: 2 columns (data.frame)
#>                     data: 1, 125 (dim)
#>                    input: 0
#>              initialTime: -30
#>             initialState: 16 (length)
#>              outputTimes: 125 (length)
#>                   events: NULL (class), NULL (type)
#>
#>                   EX51_1000nM__TRUE___TRUE
#> ------------------------------------------
#>             measurements: 2 columns (data.frame)
#>                     data: 1, 125 (dim)
#>                    input: 1
#>              initialTime: -30
#>             initialState: 16 (length)
#>              outputTimes: 125 (length)
#>                   events: NULL (class), NULL (type)
#>
#>                   EX52_1000nM__TRUE__FALSE
#> ------------------------------------------
#>             measurements: 2 columns (data.frame)
#>                     data: 1, 125 (dim)
#>                    input: 0
#>              initialTime: -30
#>             initialState: 16 (length)
#>              outputTimes: 125 (length)
#>                   events: NULL (class), NULL (type)
#>
#>                   EX53_1000nM_FALSE__FALSE
#> ------------------------------------------
#>             measurements: 2 columns (data.frame)
#>                     data: 1, 125 (dim)
#>                    input: 0
#>              initialTime: -30
#>             initialState: 16 (length)
#>              outputTimes: 125 (length)
#>                   events: NULL (class), NULL (type)
#>
#>                   EX61_2000nM__TRUE___TRUE
#> ------------------------------------------
#>             measurements: 2 columns (data.frame)
#>                     data: 1, 125 (dim)
#>                    input: 1
#>              initialTime: -30
#>             initialState: 16 (length)
#>              outputTimes: 125 (length)
#>                   events: NULL (class), NULL (type)
#>
#>                   EX62_2000nM__TRUE__FALSE
#> ------------------------------------------
#>             measurements: 2 columns (data.frame)
#>                     data: 1, 125 (dim)
#>                    input: 0
#>              initialTime: -30
#>             initialState: 16 (length)
#>              outputTimes: 125 (length)
#>                   events: NULL (class), NULL (type)
#>
#>                   EX63_2000nM_FALSE__FALSE
#> ------------------------------------------
#>             measurements: 2 columns (data.frame)
#>                     data: 1, 125 (dim)
#>                    input: 0
#>              initialTime: -30
#>             initialState: 16 (length)
#>              outputTimes: 125 (length)
#>                   events: NULL (class), NULL (type)
#>
#>                   EX72__event__TRUE___TRUE
#> ------------------------------------------
#>             measurements: 2 columns (data.frame)
#>                     data: 1, 6 (dim)
#>                    input: 1
#>              initialTime: -30
#>             initialState: 16 (length)
#>              outputTimes: 6 (length)
#>                   events: list (class), list (type)
#>
#>            EX71___dose__TRUE___TRUE_dose_1
#> ------------------------------------------
#>              outputTimes: 605
#>             measurements: 3 columns (data.frame)
#>                     data: 1, 1 (dim)
#>                    input: 1
#>             initialState: 16 (length)
#>              initialTime: -30
#>                   events: NULL (class), NULL (type)
#>
#>            EX71___dose__TRUE___TRUE_dose_2
#> ------------------------------------------
#>              outputTimes: 605
#>             measurements: 3 columns (data.frame)
#>                     data: 1, 1 (dim)
#>                    input: 1
#>             initialState: 16 (length)
#>              initialTime: -30
#>                   events: NULL (class), NULL (type)
#>
#>            EX71___dose__TRUE___TRUE_dose_3
#> ------------------------------------------
#>              outputTimes: 605
#>             measurements: 3 columns (data.frame)
#>                     data: 1, 1 (dim)
#>                    input: 1
#>             initialState: 16 (length)
#>              initialTime: -30
#>                   events: NULL (class), NULL (type)
#>
#>            EX71___dose__TRUE___TRUE_dose_4
#> ------------------------------------------
#>              outputTimes: 605
#>             measurements: 3 columns (data.frame)
#>                     data: 1, 1 (dim)
#>                    input: 1
#>             initialState: 16 (length)
#>              initialTime: -30
#>                   events: NULL (class), NULL (type)
#>
#>            EX71___dose__TRUE___TRUE_dose_5
#> ------------------------------------------
#>              outputTimes: 605
#>             measurements: 3 columns (data.frame)
#>                     data: 1, 1 (dim)
#>                    input: 1
#>             initialState: 16 (length)
#>              initialTime: -30
#>                   events: NULL (class), NULL (type)
#>
#>            EX71___dose__TRUE___TRUE_dose_6
#> ------------------------------------------
#>              outputTimes: 605
#>             measurements: 3 columns (data.frame)
#>                     data: 1, 1 (dim)
#>                    input: 1
#>             initialState: 16 (length)
#>              initialTime: -30
#>                   events: NULL (class), NULL (type)
#>
#> experiments:  EX11____0nM__TRUE___TRUE, EX12____0nM__TRUE__FALSE, EX13____0nM_FALSE__FALSE, EX21__100nM__TRUE___TRUE, EX22__100nM__TRUE__FALSE, EX23__100nM_FALSE__FALSE, EX31__200nM__TRUE___TRUE, EX32__200nM__TRUE__FALSE, EX33__200nM_FALSE__FALSE, EX41__500nM__TRUE___TRUE, EX42__500nM__TRUE__FALSE, EX43__500nM_FALSE__FALSE, EX51_1000nM__TRUE___TRUE, EX52_1000nM__TRUE__FALSE, EX53_1000nM_FALSE__FALSE, EX61_2000nM__TRUE___TRUE, EX62_2000nM__TRUE__FALSE, EX63_2000nM_FALSE__FALSE, EX72__event__TRUE___TRUE, EX71___dose__TRUE___TRUE_dose_1, EX71___dose__TRUE___TRUE_dose_2, EX71___dose__TRUE___TRUE_dose_3, EX71___dose__TRUE___TRUE_dose_4, EX71___dose__TRUE___TRUE_dose_5, EX71___dose__TRUE___TRUE_dose_6
Here, we set parameters that we obtained as a result of uncertainty quantification as the default parameters don’t produce a good fit, they are still not optimal:
p <- c(3.38,-0.22,-0.39,0.0013,7.89e-2,-1.02,-1.08,-2.86,-0.53,-0.34,-0.51,-2.42,-1.05,-1.37,-1.29,2.08,-2.79,-0.87,0.26,-0.168,-0.331,-1.77,-0.938,1.065,2.08,0.0147,-0.09893)
names(p) <- rownames(m$Parameter)
If instead we wanted to use the default parameters, then we could use this code:
p <- values(m$Parameter)Simulate
Function simstoch will return a function s,
which will always simulate the scenarios described in the list of
experiments (i.e., same initial conditions, same inputs), but for user
supplied parameters.
E <- 9 #index of the experiment to consider

# generate a function (s) that simulates a trajectory given a parameter in input
s <- simstoch(ex, cme, parMap=log10ParMap)

# simulate a trajectory (y) given parameter p
ystc <- s(p)
Simulation Results via ggplot2
require(ggplot2)
#> Loading required package: ggplot2
require(errors)
#> Loading required package: errors

D<-data.frame(
    time=ex[[E]]$outputTime,
    AKAP79=as.numeric(ex[[E]]$data),
    AKAP79ERR=as.numeric(errors(ex[[E]]$data)),
    sim=as.numeric(ystc[[E]]$func[1,,1]))
ggplot(D) +
  geom_linerange(mapping=aes(x=time,y=AKAP79,ymin=AKAP79-AKAP79ERR,ymax=AKAP79+AKAP79ERR),na.rm=TRUE) +
  geom_point(mapping=aes(x=time,y=AKAP79),na.rm=TRUE) +
  geom_line(mapping=aes(x=time,y=sim),color="purple",lwd=1.2)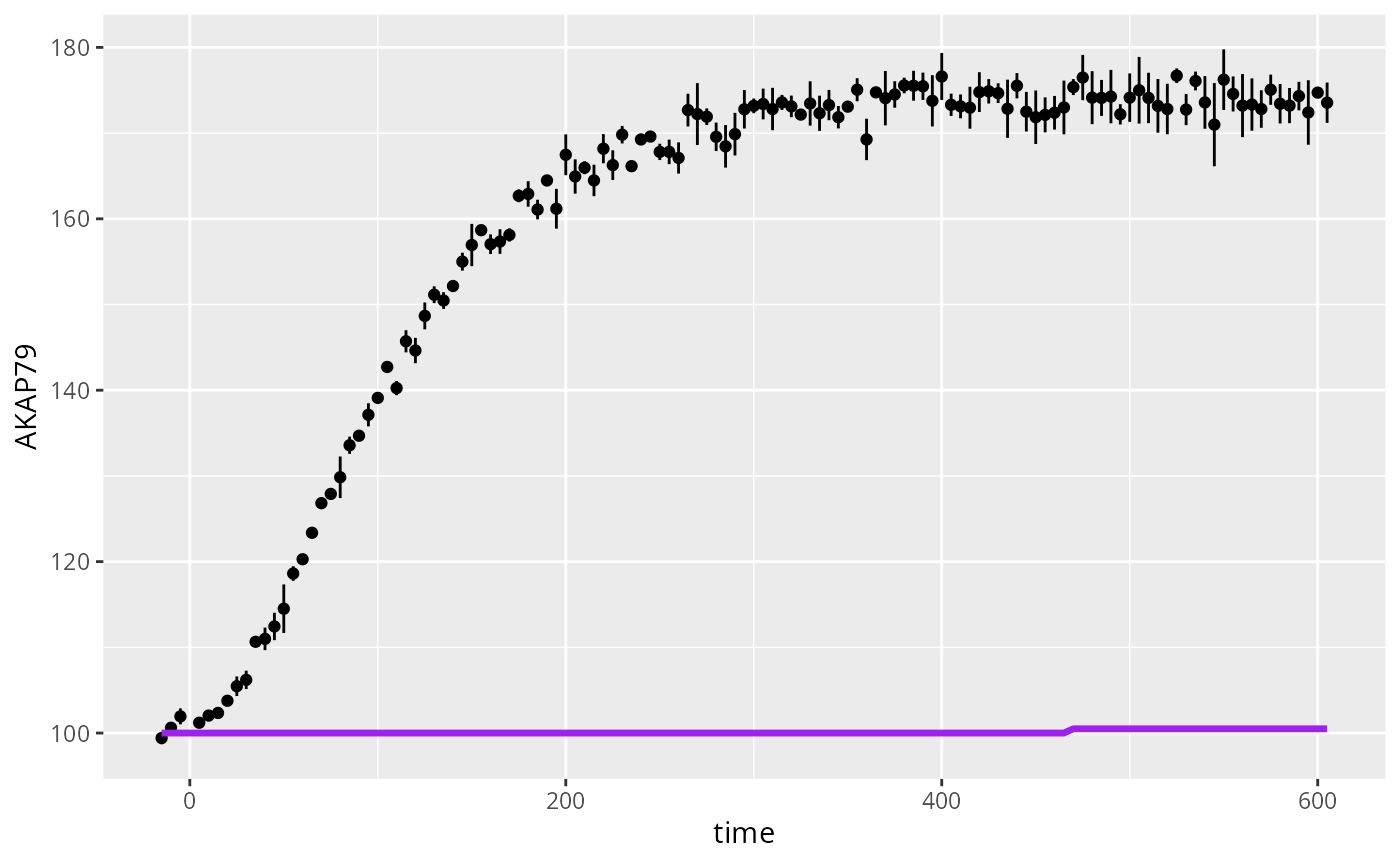
o <- as_ode(m)
c_path(o) <- write_c_code(generate_code(o))
so_path(o) <- shlib(o)
sode <- simfi(ex,o,parMap=log10ParMap)
yode <- sode(p)
And also plot the results:
tm <- ex[[E]]$outputTimes
oldpar <- par(bty="n")
plot(
    as.errors(tm),
    ex[[E]]$data,
    xlab="time",
    ylab="AKAR4p",
    main=names(ex)[E],
    ylim=c(90,210)
)

lines(tm,as.numeric(ystc[[E]]$func["AKAR4pOUT",,1]),lwd=1,col="blue")
lines(tm,as.numeric(yode[[E]]$func["AKAR4pOUT",,1]),lwd=3)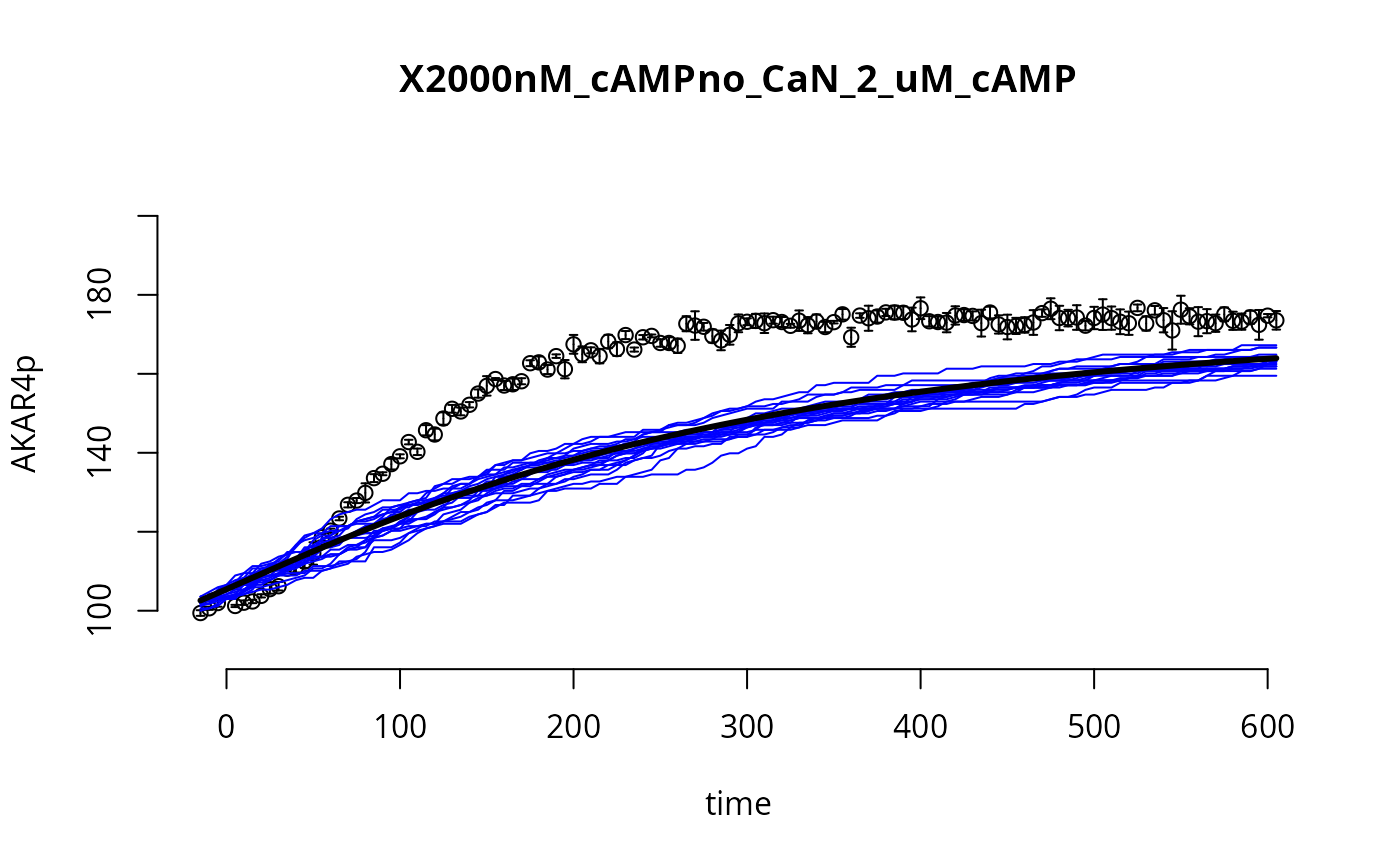
par(oldpar)