Simulating a model
simulate.RmdReaction network models can be simulated as deterministic models or stochastic models. In this article we show the deterministic approach. An example of how to simulate from the stochastic model is available in this article.
Given a reaction network model, we can use the law of mass action to derive an ODE system that describes how the concentrations of the compounds in the system change in time.
To simulate the reaction network model deterministically with UQSA
you can use the simulator.c function:
simulate <- simulator.c(ex, o, parMap = parMap)This has created a closure
(simulate), with a single argument p:
y <- simulate(p)The simulate function remembers the experiments that it
was created with and produces results of the same length as
ex (the list of simulation experiments), with the same
experimental conditions.
It is often convenient to modify the parameters before passing them to the model. Here are possible reasons:
- the uncertainty is log normal
- you want to pass
exp(log(p) + rnorm(...))to the model rather thanpitself
- you want to pass
- the Markov chain is in log-space
- the sampler uses
p, but the model needs10^p
- the sampler uses
- the model parameters are linearly dependent
- we have to reliably pass something like:
c(p[1]+p[2], p[2]+p[3], p[3]-p[1])to the model, every time
- we have to reliably pass something like:
In such cases, you can write a mapping function, and use the
parMap argument-slot of simulator.c:
library(uqsa)
library(errors)
library(parallel)

f <- uqsa_example("AKAR4")
m <- model_from_tsv(f)
o <- write_and_compile(as_ode(m))
ex <- experiments(m,o)
print(ex)
#> number of simulation experiments: 3
#>                                      400nM
#> ------------------------------------------
#>             measurements: 2 columns (data.frame)
#>                     data: 1, 225 (dim)
#>                    input: 2 (length)
#>              initialTime: -15
#>             initialState: 2 (length)
#>              outputTimes: 225 (length)
#>                   events: NULL (class), NULL (type)
#>
#>                                      100nM
#> ------------------------------------------
#>             measurements: 2 columns (data.frame)
#>                     data: 1, 225 (dim)
#>                    input: 2 (length)
#>              initialTime: -15
#>             initialState: 2 (length)
#>              outputTimes: 225 (length)
#>                   events: NULL (class), NULL (type)
#>
#>                                       25nM
#> ------------------------------------------
#>             measurements: 2 columns (data.frame)
#>                     data: 1, 225 (dim)
#>                    input: 2 (length)
#>              initialTime: -15
#>             initialState: 2 (length)
#>              outputTimes: 225 (length)
#>                   events: NULL (class), NULL (type)
#>
#> experiments:  400nM, 100nM, 25nM
For example, here parameters are in log-space.
simulate <- simulator.c(ex,o,parMap=logParMap)
p <- log(values(m$Parameter))
print(p)
#> kf_C_AKAR4 kb_C_AKAR4 kcat_AKARp
#>  -4.017384  -2.244316   2.322388
#> attr(,"unit")
#> kf_C_AKAR4 kb_C_AKAR4 kcat_AKARp
#>   "1/uM*s"      "1/s"      "1/s"

rprior <- rNormalPrior(mean=p,sd=0.2)

P <- rprior(150)
print(dim(P))
#> [1] 150   3
All simulations happen here (timed):
opt <- options(mc.cores=parallel::detectCores())

ti <- Sys.time()
y <- simulate(t(P))
tf <- Sys.time()

print(difftime(tf,ti))
#> Time difference of 0.08167839 secs
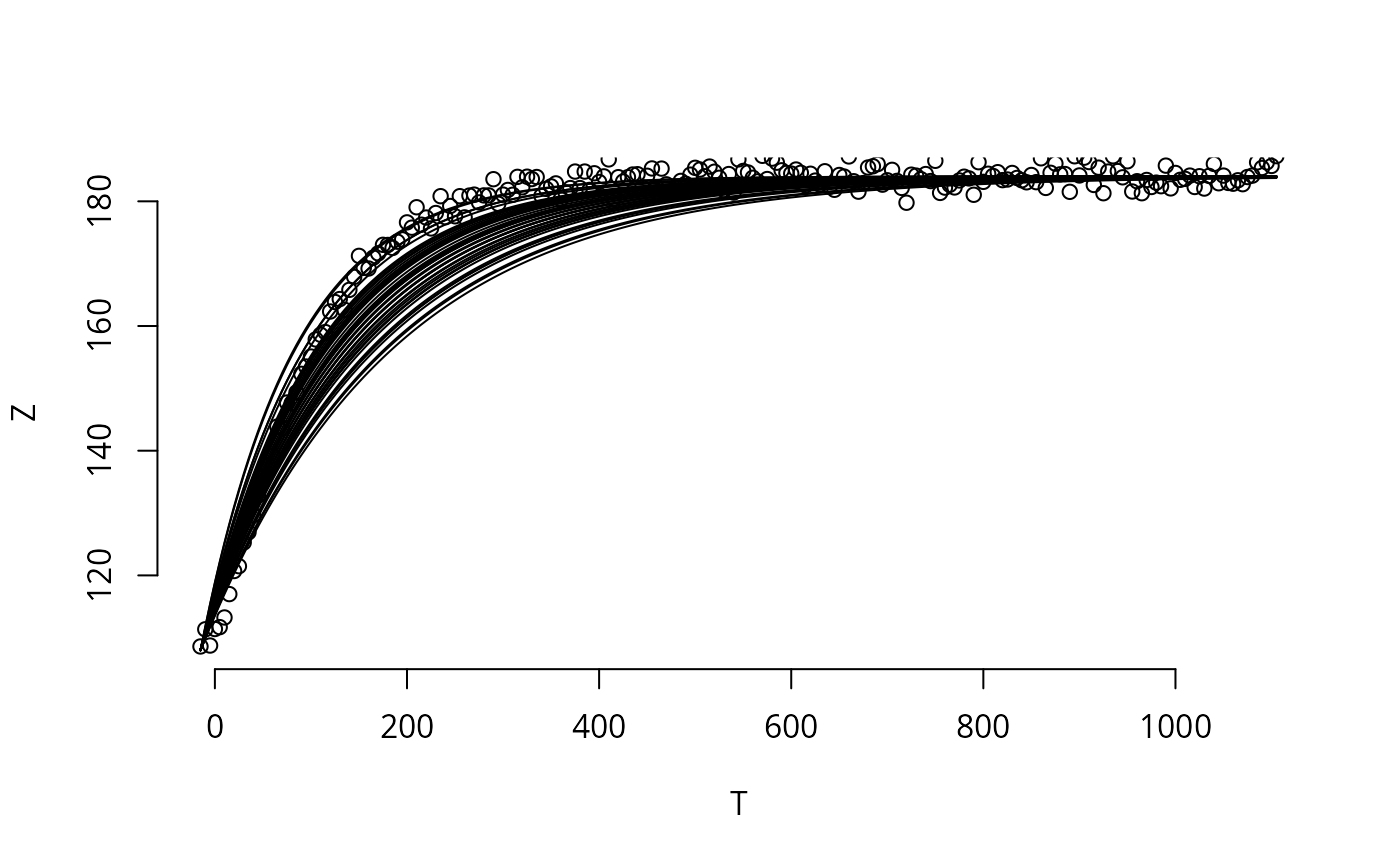
The matrix P has columns of model parameters that are
log-normally distributed around OK-ish values (taken from the TSV file
AKAR4/Parameter.tsv):
oldpar <- par(mfrow=c(3,1))
for (i in seq(ex)){
    tm <- ex[[i]]$outputTimes
    plot(               # data
        as.errors(tm),
        ex[[i]]$data,
        main=names(ex)[i],
        xlab="time",
        ylab='AKAR4pOUT'
    )
    matplot(            # simulation
        tm,
        y[[i]]$func['AKAR4pOUT',,],
        add=TRUE, type="s",
        lwd=3, lty=1, col=rgb(0,0,1,0.1)
    )
}
par(oldpar)
options(opt)