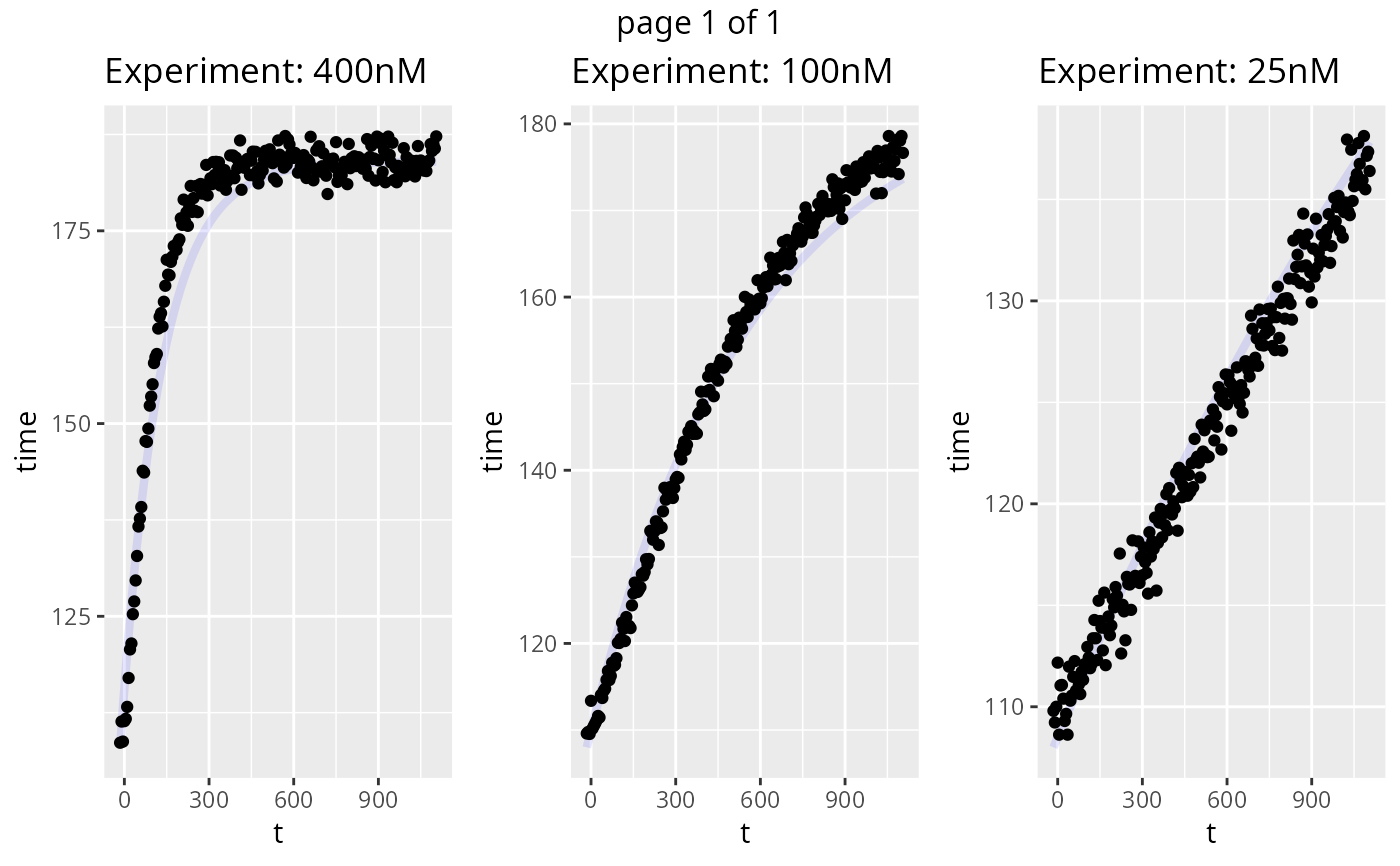
Plot time series simulations with experimental data
ggplot_time_series.RdThis function plots simulations of time series experiments and plots them against experimental data. The input in the provided experiments must differ only in one vector component.
Arguments
- simulations
list of simualtions as output from the simulator
- experiments
list of experiments
- show.plot
boolean variable. Set show.plot=TRUE to display plots when running the funcion, FALSE otherwise
Examples
m <- model_from_tsv(uqsa_example("AKAR4"))
o <- write_and_compile(as_ode(m))
ex <- experiments(m,o)
s <- simulator.c(ex,o)
p0 <- values(m$Parameter)
y <- s(p0)
ggplot_time_series(y,ex)
#> Warning: In '<' : boolean operators not defined for 'errors' objects, uncertainty dropped