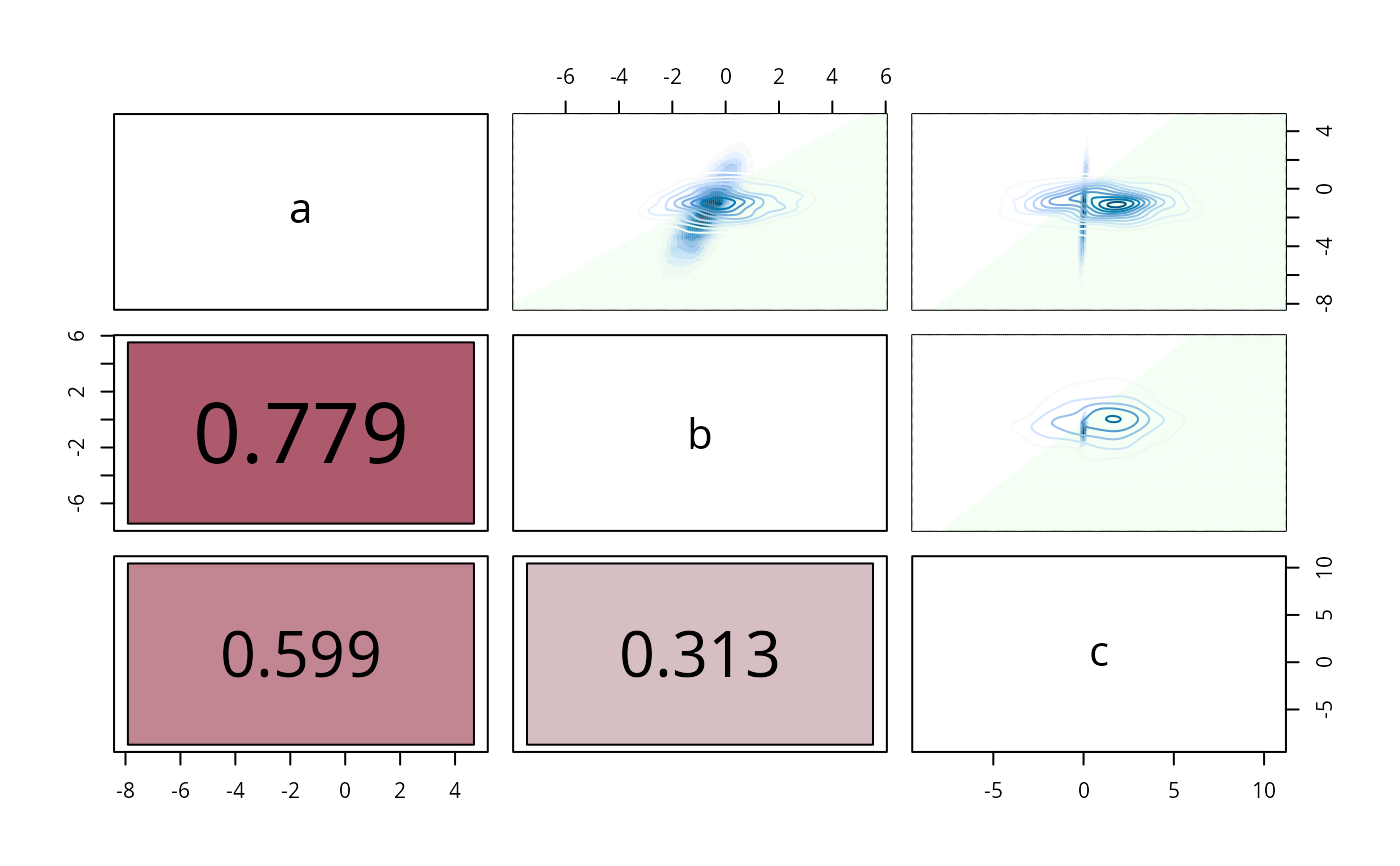
showPosterior makes a pairs plot for a sample
showPosterior.RdThis function will display the difference between the posterior and prior by plotting the posterior as shaded density plots and the prior as contour lines of level sets. If the two are identical, the lines will be invisible as they blend into the density plot. Otherwise the contour lines will show up as a distinct feature.
Arguments
- posterior
a matrix, each row is a sample member
- prior
a matrix of the same size as the posterior
- ...
passed to
graphics::pairs()