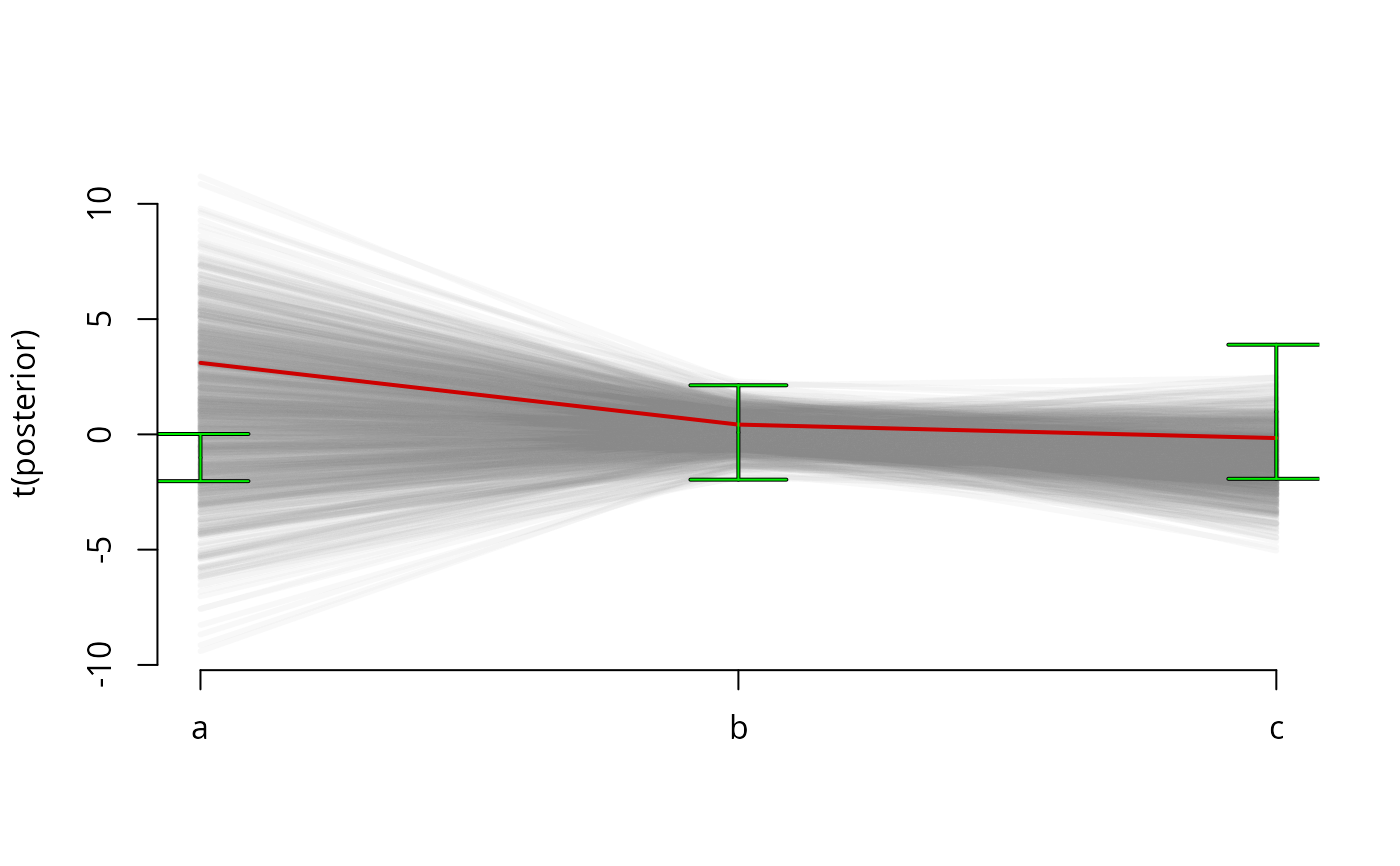
plots a sample in parallel coordinates
pcDist.RdThis function makes a plot that is quite similar to parallel coordinates. It includes information about the prior as error-bars, centered around th eprior's median.
Usage
pcDist(posterior, prior, color = rgb(0.5, 0.5, 0.5, 0.05), ...)Arguments
- posterior
a matrix, with N rows (sample-members), and M columns (different model parameters). The columns must be named.
- prior
a data.frame with at least $median, and $stdv columns. This data.frame may also include the fields: color, and colorOutline to change the prior error-bars.
- color
the color of the sample lines, should have some transparency.
- ...
parameters are passed to matplot.